Update of the experiment canvas view and a new table view
![]() 3 min read
3 min read
SciNote’s experiment canvas view has gotten some small updates. Additionally, we’ve added a new table view of tasks inside the experiments.
Contents
Canvas view update
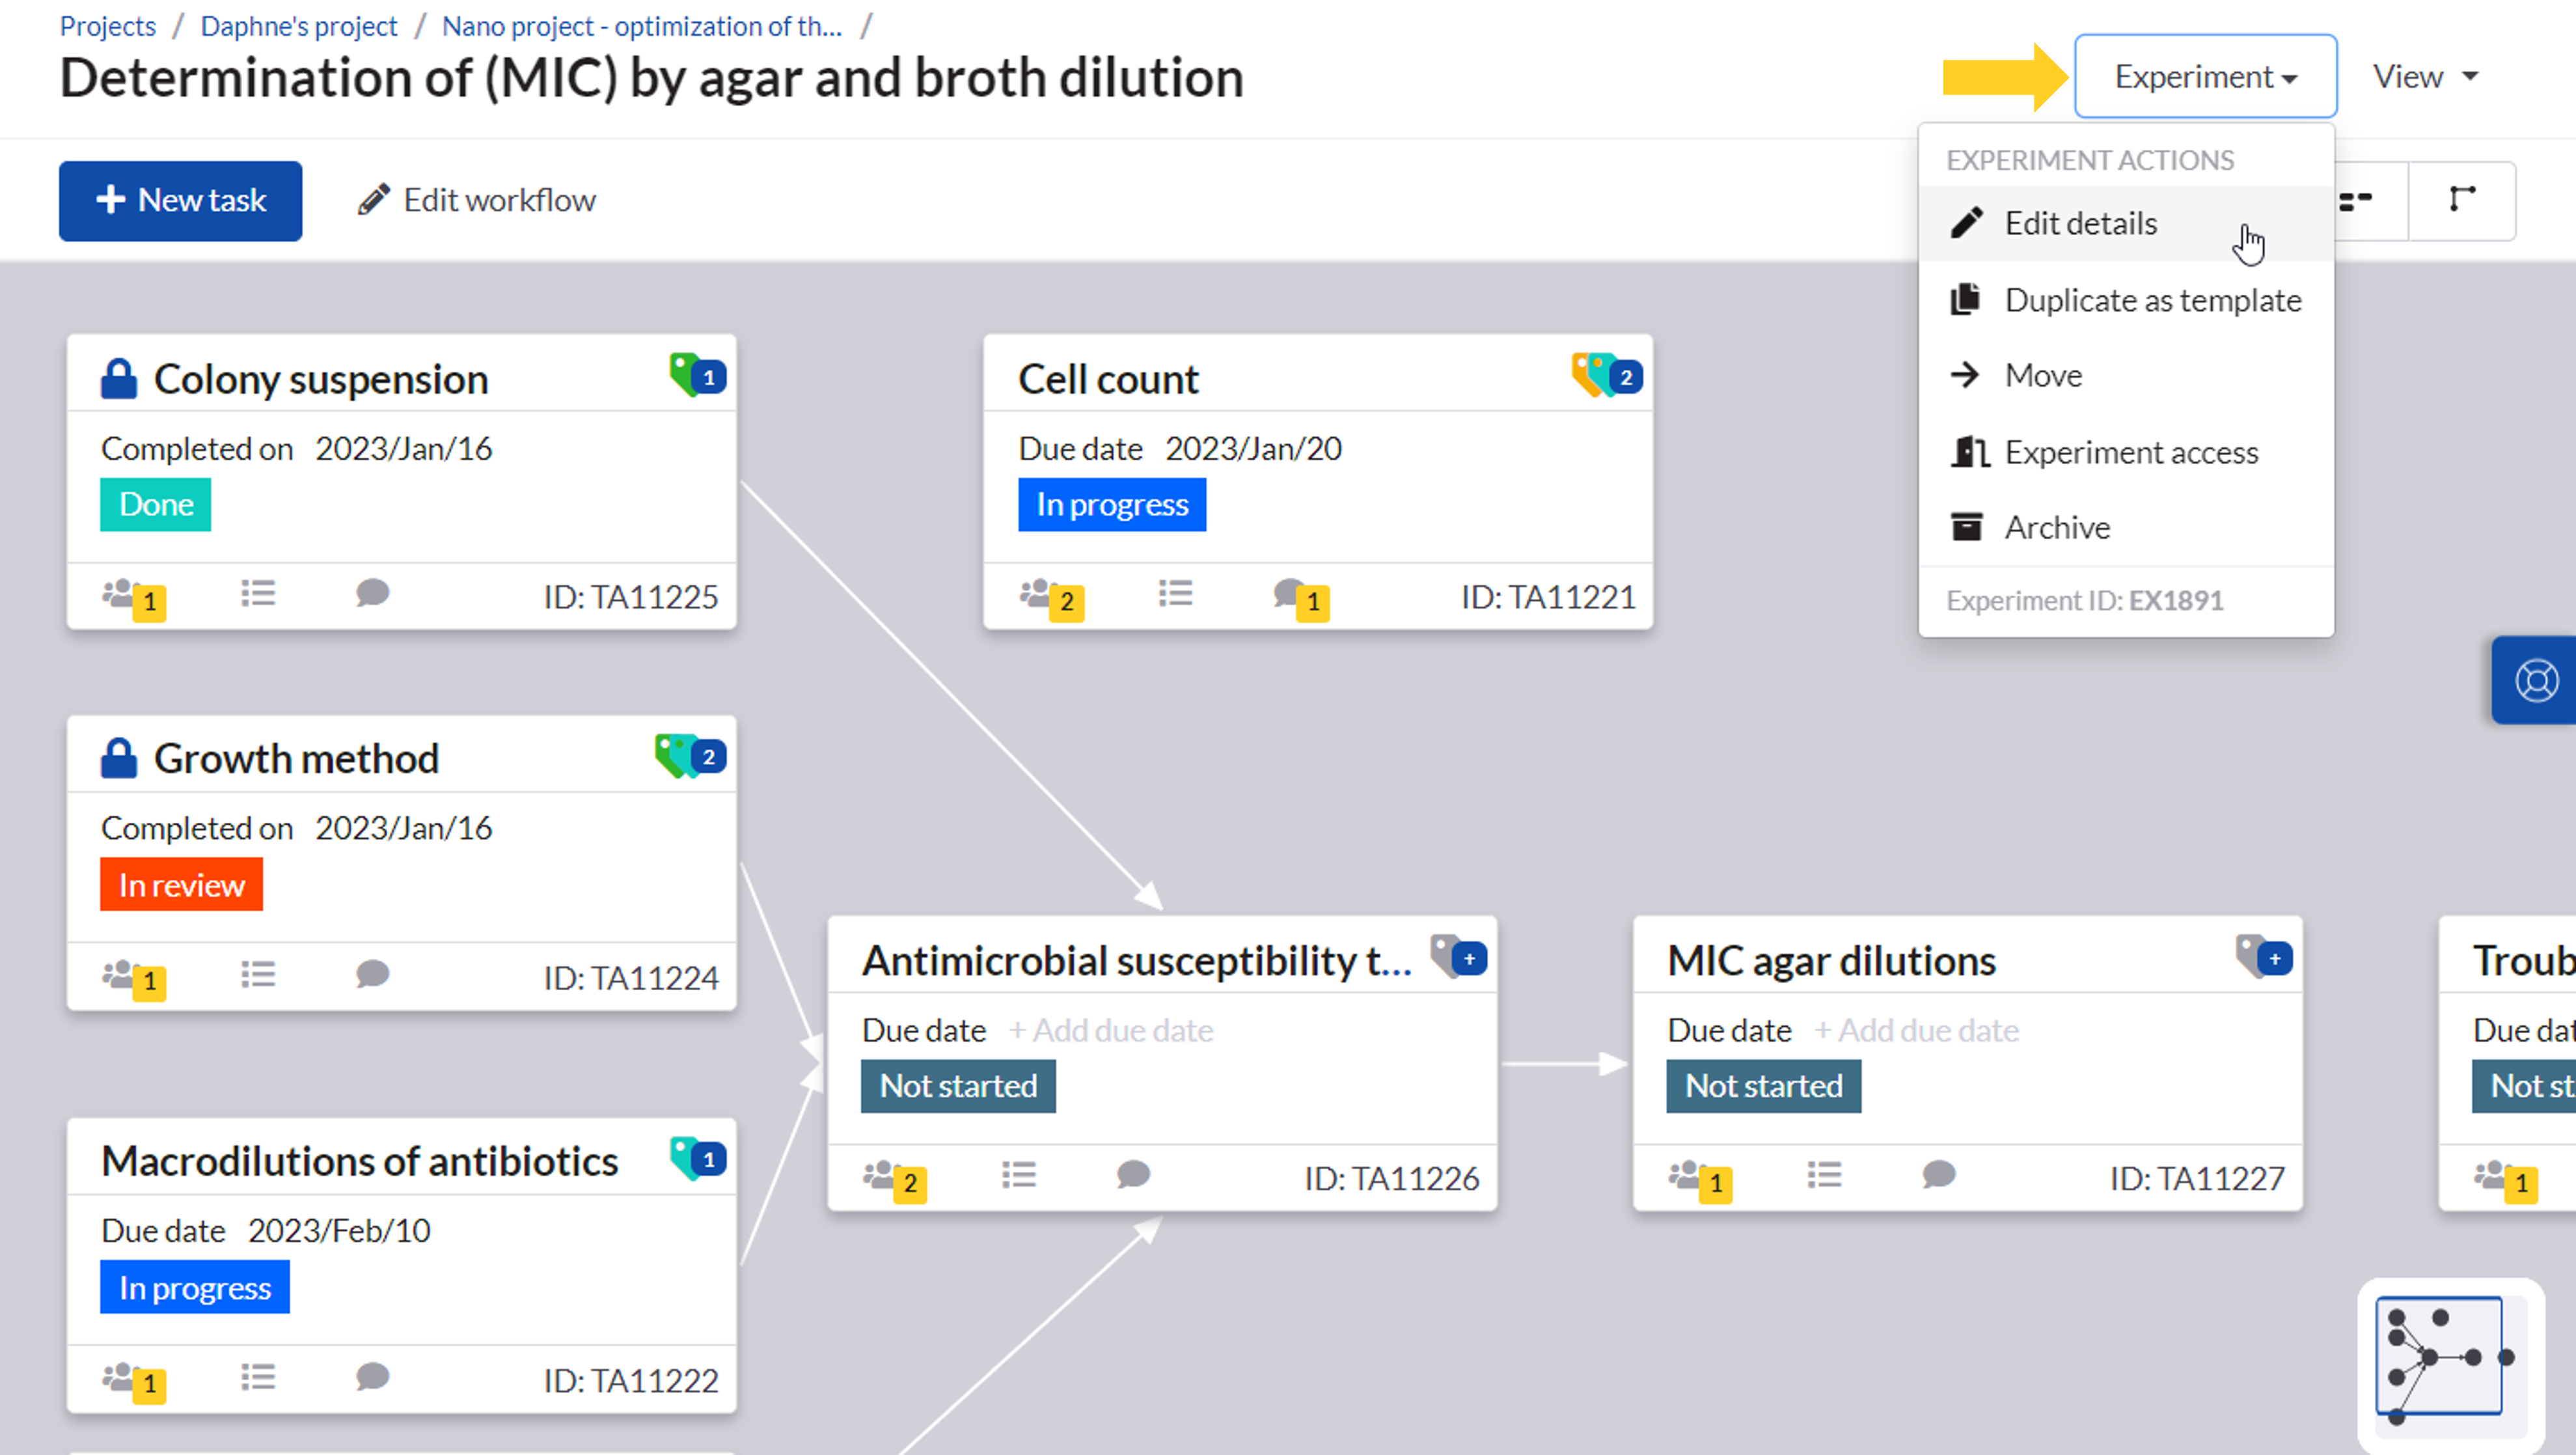
You’ll notice some updates in the experiment Canvas view. The title row and the toolbar are a bit different from before. Let’s go over the toolbar first.
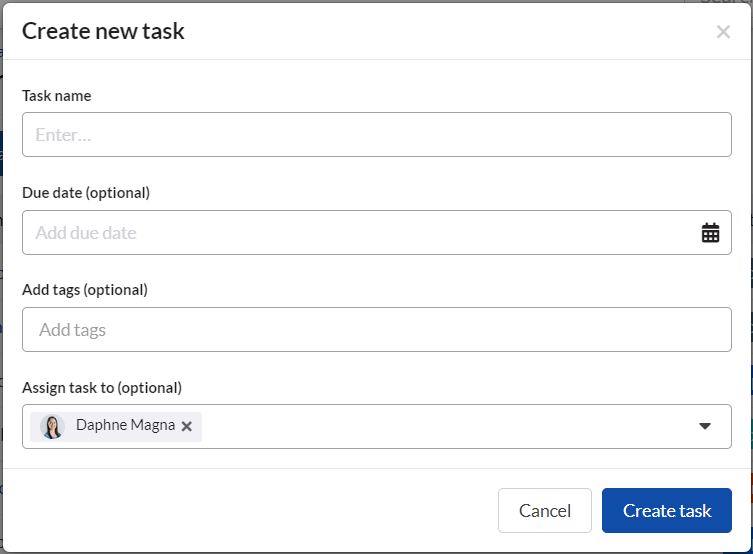
The toolbar has a new shortcut for creating new tasks without the need to edit the experiment workflow. Clicking on the “+ New task” button opens the window where you can name the task, add the due date, and tags or assign a task to your coworker if you are a project owner.
You can now edit the task’s positions and connections using the button “Edit workflow” that’s next to the blue “+ New task” button.
Experiment actions are moved to the right side of your experiment’s name. Click on the button “Experiment” to find all actions in the flyout.
Switching between view types
Have you noticed a new button named “View” in the top right corner?
In the View flyout, you can choose how you view your tasks inside an experiment. We added a new Table view and a shortcut to your archived tasks.
Don’t worry, even if you choose the Table view, you won’t lose the experiment workflow created on the canvas. Your tasks’ positions and connections are safely stored, and you can always see or edit them when you go to the Canvas view.
However, the default view is still the Canvas view. If you choose to switch to the Table view, your selection will be remembered for each experiment.
The new Table view of tasks
At first glance, the new Table view of tasks looks very similar to the Table view of experiments or projects in the upper two levels of SciNote’s data hierarchy. You can sort your tasks and filter out specific tasks, and easily create new tasks using the “+ New task” button.
Handy shortcuts available in the table
You’ll also find additional information about your tasks, as well as useful shortcuts, via the Table view. Let’s go through them together.
The task’s unique ID and its age are now visible in the table. You can also view the number of requested and submitted task signatures if you have the signatures add-on.
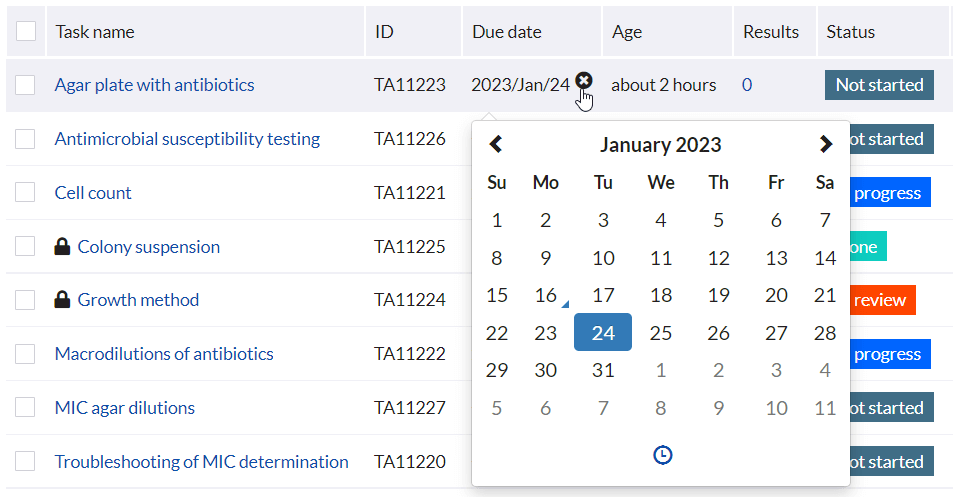
You can set the due dates for your tasks directly in the Due date column. Simply click on the “Add due date” button, and a date picker will open for you.
The number of task results is now visible in the Results column. You can quickly access the results page inside the task by clicking on the number.
If you wish to manage the person assigned to a task without going into the task, you can do that directly in the Assigned to column. Users who don’t have editing permissions won’t be able to do so; they will only see those assigned to the task. Note that managing task access is available in the three dots menu on the far right side of the table.
The Tags column offers you direct access to managing tags.
Task comments can be added via the + icon in the Comments column. We also updated the comments display.
Lastly, there is a three dots menu, where you can find other actions related to a task.
Manage what you see in the Table view
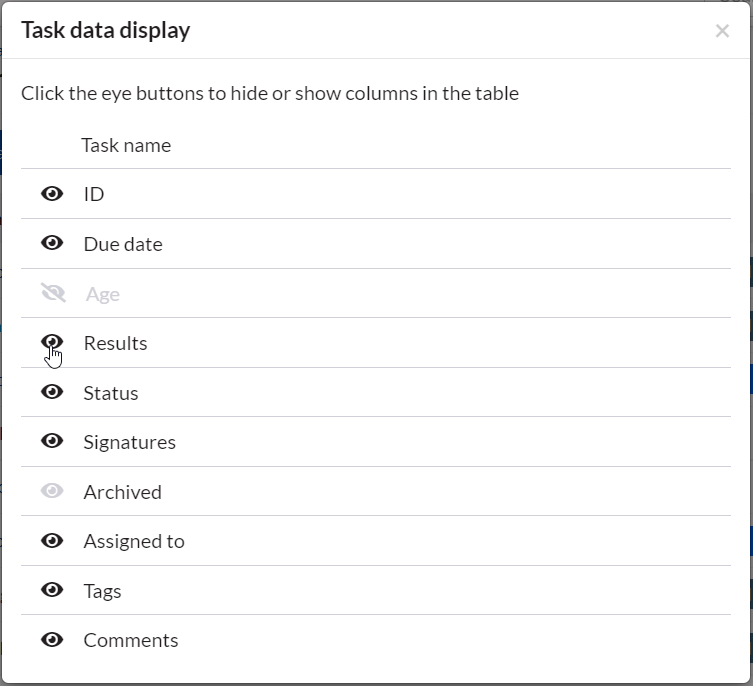
You can manage what task information you see in the table using the “Task data display” button. This helps you customize the Table view based on your needs.
Clicking on the “Task data display” will open a window where you can hide or show the data columns. Simply click on the eye icon to toggle the column visibility. Your selection will be remembered for you per experiment.
Do you have any questions about this feature update? Feel free to contact your customer success manager for more information or assistance.
